I got this question often: which is the best Data Visualization product? Lets compare some DV platforms such as Spotfire, Qlikview, Tableau Software and the Microsoft BI platform (PowerPivot, Excel 2010, SQL Server with its VertiPaq, SSAS, SSRS and SSIS). 2 key factors for tool selection are
- which makes it easy to comprehend the data,
- price-performance
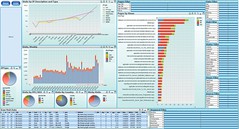
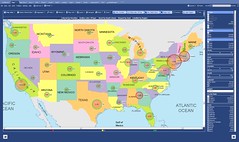
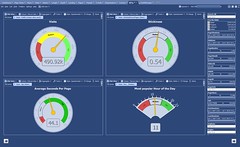
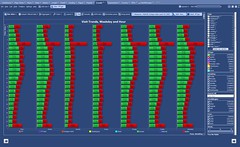
Because modern datasets are huge (or growing very fast!), they are usually best comprehended using Data Visualization (DV) with an ability to interact with data through visual drill-down capabilities and dashboards. There is NO a single best visualization product. Each has its place. For example, Spotfire has best web client and analytical functionality. On the other hand, Qliktech may be the best visualization product for interactive drill-down capabilities. The Microsoft BI platform provides better price-performance ratio and good as a backend for DV (especially with release of SQL Server 2012) or for people who wish to build own (that will be a mistake) DV. Tableau has the best ability to interact with OLAP cubes etc. We put into a summary table the comparison of 4 Platforms to help you to evaluate DV products, based on your needs.
| Criteria | Spotfire | Qlikview | Tableau | MS BI Stack | Comment |
| Business Criteria | ======= ======= ======= ======= | Speed, Scalability, Price | |||
| Implementation Speed | Good | High | Good | Average | Qlikview is fastest to implement |
| Scalability | Unlimited | Limited by RAM | Very Good | Good | Need the expert in scalable SaaS |
| Pricing | High | Above Average | High | Average | Microsoft is the price leader |
| Licensing/support cost | High | High | High | Average | Smart Client is the best way to save |
| Enterprise Readiness | Excellent | Good for SMB | Good for SMB | Excellent | Partners are the key to SMB market |
| Long-term viability | Good | 1 product | Average | Excellent | Microsoft are 35+ years in business |
| Mindshare | Analytics Market | Growing fast | Growing fast | 3rd attempt to win BI | Qlikview is a DV Leader, Successful IPO |
| Technical Criteria | ======= ======= ======= ======= | Drilldown, Analytics, UI | |||
| Clients for End Users | ZFC, Spotfire Silver | RIA, ZFC, Mobile | Windows, ZFC | Excel, .NET | Free Qlikview Personal Edition is a big plus |
| Interactive Visualization | Very Good | Excellent | Very Good | As good as Excel | Most users value Visualization over Modeling |
| Data Integration | Good | Good | Excellent | Good | Need for Data Integration expert |
| Visual Drill-Down | Very Good | Excellent | Good | Average | Qlikview is fastest thanks to in-memory database |
| Dashboard Support | Very Good | Excellent | Good | Below Average | Spotfire and Qlikview are best for Dashboards |
| Integration with GIS | Excellent | Good | Good | Average | Spotfire has the best GIS integration |
| Modeling and Analytics | Excellent | Weak | Excellent OLAP | Good with SSAS | Spotfire is the best, Excel is the most popular |
| UI & set of Visual Controls | Very Good | Best | Very Good | Good | Need for UI expert to integrate DV components |
| Development Environment | Rich API, S+ | Scripting, Rich API | Average | Excellent | Tableau requires less consulting than competitors |
| 64-bit In-Memory Columnar DB | Very Good | Excellent | In-memory Data Engine | Very Good | 64-bit RAM allows huge datasets in memory |
| Summary – Best for: | Visual Analytics | DV, Drilldown | Visual OLAP | Backend for DV |
Good Visualization requires a customization! |
We also suggest for you to take a look on other comparisons: Altheon comparing Qlikview, Tableau and Omniscope and others (please ping me if you will find good comparison of DV tools).
Notes.
- TIBCO is a vendor of the balanced Spotfire Platform: Spotfire Professional, Server, Enterprise and Web Players, S-Plus, DecisionSite, Metrics, Data Automation and Miner technologies, combining in-memory database with interactive Data Visualization, advanced analytics (S+), data mining and multi-filtering functionality. Spotfire 3.2.1 provides best web client and supports iPad
- Qliktech is a vendor of Qlikview DV Platform: Qlikview Developer, Qlikview Server, Publisher and Access Point tools with a leading in-memory columnar database combined with advanced Visual Drill-Down, Interactive Dashboards and comprehensive set of client software, running even on SmartPhones.
- Microsoft is a vendor of the most comprehensive set of BI and DV components, including SQL Server, Analytical, Reporting and Integration Services (SSAS, SSRS, SSIS), Sharepoint, Excel 2010 with PowerPivot add-in (Excel is the most popular BI tool, regardless) and VertiPaq engine. I did not include PerformancePoint Server: it was discontinued in April 2009 and PerformancePoint Services from SharePoint I cannot recommend, because I CAN NOT recommend SharePoint.
- DV expert can be a cost-effective customizer of all of the above with the ability to customize DV with development components from leading technological vendors like Dundas, DevExpress etc.
- I did not include Oracle, because it does not have own DV tool; however Oracle is an OEM partner with Tableau and resell it as a part of OBIEE toolset.
DV expert can help to select the appropriate DV approach for your specific application. Additional services include the following:
- Professional gathering of business requirements, system analysis of workflow and dataflow, and functional specifications;
- The custom software development for Extract, Transform and Load (ETL) processing from large Client Databases into in-memory superfast columnar DB and interactive OLAP Cubes;
- Design of Custom Data Visualization and dashboards deployed over the Internet through smart client and RIA technologies.
Custom DV applications enable the user to perform visual drill-down, fast searches for outliers in large datasets, easy-to-use root-cause and business logic analysis, interactive data search, and visual and predictive analytics. Some factors and/or features are very important and some I did not mention because they will be mentioned on other pages and posts of this blog (e,g, see “in-memory” page and DV Tools pages. I perceive that DV area has 4 super-leaders in this area: Qlikview 10, Spotfire 3.3, Tableau 6.1 and PowerPivot, but for completeness (because the real function is to be a “Data Visualizers”), I wish to add Visokio’s Omniscope. I do not include vendors who are 1-2 generation behind: SAP, SAS, IBM, Oracle, Microstrategy and I can add to this list a dozen more of mis-leaders. Many vendors working on some in-memory technology. Tableau 6.X has now in-memory data engine (64-bit).
Additional factors to consider when comparing DV tools (table above overlaps with list below):
- – memory optimization [Qlikview is the leader in in-memory columnar database technology];
- – load time [I tested all products above and PowerPivot is the fastest];
- – memory swapping [Spotfire is only who can use a disk as a virtual memory, while Qlikview limited by RAM only];
- – incremental updates [Qlikview probably the best in this area];
- – thin clients [Spotfire has the the best thin client, especially with their recent release of Spotfire 3.2 and Spotfire Silver];
- – thick clients [Qlikview has the best THICK client, Tableau has free Desktop Reader, Visokio has Java-based Omniscope Desktop Viewer] ,
- – access by 3rd party tools [PowerPivot’s integration with Excel 2010, SQL Server 2008 R2 Analysis Services and SharePoint 2010 is a big attraction];
- – interface with SSAS cubes [PowerPivot has it, Tableau has it, Omniscope will have it very soon, Qlikview and Spotfire do not have it],
- – GUI [3-way tie, it is heavily depends on personal preferences, but Qlikview is more easy to use than others];
- – advanced analytics [Spotfire 3.2 is the leader here with its integration with S-PLUS and support for IronPython and other add-ons]
- – the productivity of developers involved with tools mentioned above. In my experience Qlikview is much more productive tool in this regard.



December 10, 2010 at 12:10 pm
Wow
It is so amazing comparison chart.
good luck.
July 9, 2012 at 2:54 pm
The latest is that QlikView now has several Enterprise clienst supporting over 40k users and is also moving BIG data, need to look at HOW they do it as the secrete is in the comperessions at every step. Gartner calls it the most performant on BIG data, so take a peek at updateing your Enterprise readiness here, please.
December 21, 2010 at 9:21 pm
This analysis looks spot-on. Thanks for publishing this.
January 20, 2011 at 3:52 am
Great post ! Any particular reason Oracle wasn’t included ? Do you think they’re not ready for DV ?
February 1, 2011 at 3:34 pm
Johan:
As I said above, Oracle does not have a good own DV Product (you can say Oracle is not ready), instead Oracle OEM-ed Tableau and sell it under name of Visual Explorer.
February 8, 2011 at 8:46 am
Andrei
Nice post – and thanks for the link to our QlikView/Omniscope/Tableau comparsion too. A quick one for you – my understanding is that Tableau *can* use virtual memory for large in-memory models (from v6 onwards) – your comments suggest that only Spotfire does this?
February 8, 2011 at 8:53 am
Guy:
Starting with v6 Tableau has in-memory data engine and can use a virtual memory too, somewhat similar to Spotfire.
November 4, 2011 at 5:05 pm
I’m very new to this space, exploring DV (Data Visualization) environments + tools for a client. Why isn’t Dundas on the list? Is there something in the definition of DV as a market that excludes them? Or are they just not a player? Any thoughts on their v 3.3?
November 4, 2011 at 10:22 pm
Hi Jay:
Dundas has very good products (especially their latest releases, see http://dundas.com/dashboard/online-examples/ ) , as well as Infragistics, DevExpress and some other vendors. But their products can not be considered as Data Visualization tools but rather as DV SDK (Software Development Kit). This can help only to developers who are creating own DV solutions, but not to DV users and analysts.
Even if you as an analyst and developer, have both development (say C# and .NET) and analytical application skills (say you can use Qlikview to produce DV solution), I still will not recommend Dundas and similar vendors for very simple reason: productivity of the coder 30 times less then productivity of experienced application developer who are using real DV tools instead of DV SDK and Visual Studio.
It is why Dundas cannot be on my list of DV tools, despite my love for Dundas, Infragistics etc.
November 11, 2013 at 4:38 am
Hi Andrei, thanks for an insightful blog. Interested in this: “productivity of the coder 30 times less then productivity of experienced application developer“. Have you tested this? Our BI team wants Tableau, but corporate leaders are pushing for Dundas because of the lower price. We need good arguments to show that despite low licencing the cost of working with this tool is higher.
November 11, 2013 at 12:05 pm
Yes Navash:
I tested it and the usage of SDKs from Dundas or similar vendors is much less productive, requires lengthy SDLC and overall will cost you more and not less money but you need to construct your arguments yourself – may be you can even publish them as comments on my blog here.
Also see additional info here: https://apandre.wordpress.com/2013/10/06/bi-is-dead/
Regards, Andrei
November 8, 2011 at 5:11 am
The fact that you need specialized IT resources to design and build the ETL, data warehouse, star schema and corresponding cubes indicates that the Microsoft BI stack is exactly the opposite of self service BI. IT cannot predict every question that will be answered, and so there will always be new data requirements. By the time you have IT design, quote, develop, test and then deliver a new dimension you have probably already forgotten the question you wanted to ask.
November 14, 2011 at 2:23 pm
Really impressed with your comparison and hope to add some value in the future. Thanks for the effort
December 29, 2011 at 10:39 am
[…] Comparison […]
February 9, 2012 at 5:03 pm
Hello:
Is this information public may I use it for knowledge sharing in my workplace to help users understand differences between these analytic application?
Mfanyi
February 9, 2012 at 5:57 pm
Hi Mfanyi:
you can use this information under the following conditions:
you have to mention that this comparison was done by Dr. Andrei Pandre (me) and you have to provide credits, references and links to this blog/website/post/webpage:
and respect my copyrights as the author of this article.
You cannot tell your coworkers or anybody else that you did this work, but you can point them to this article above and you can provide the info about me by sharing this link:
Andrei
February 17, 2012 at 12:44 am
[…] Comparison […]
March 1, 2012 at 3:40 am
Hello:
I have been a follower of your blog.. Thanks for the excellent work.
Regarding Tableau and Spotfire whether this comparison is updated with the new releases of the software, or there is anything we can refer to get the latest comparisons between them.
Many thanks,
Roy
March 1, 2012 at 7:39 am
Hello Roy:
this page (written more than a year ago) is so popular, so I kept delaying the update of it with very good excuse: it takes a lot of time to do it. I got many requests to refresh it and will try to do it as soon as I can.
Good news for you: I published recently the updated comparison including Tableau, Spotfire and Qlikview here:
and also you can check my recent blog post here:
Again, this Comparison Page will be updated when I will have enough time.
March 7, 2012 at 5:34 pm
Great post, great details.
I wrote a more ‘plain english layman terms’ comparison on Tableau vs Qlikview which your readers might find interesting:
http://reports4u.co.uk/2011/06/12/tableau-vs-qlikview/
As you’ll see this was written in a non technical way and all based on my own experiences, far less thorough than your comparison but hopefully useful to your readers anyway.
April 9, 2012 at 10:25 am
Hello Andrei,
I am currently working on a project to improve data visualization within a large consumer product organization. We use SAP BW to get raw data, so I would like to know which DV product you would recommend to integrate with this BI platform?
Thank you
April 9, 2012 at 6:54 pm
Hi Rafael:
all 3 DV leaders support SAP, 2 of them mentioned by own SAP’s press-release:
http://www.sap.com/corporate-en/press.epx?PressID=18063.
Qlikview has SAP connector, see it here:
http://www.qlikview.com/us/explore/solutions/data-source/sap
Spotfire has the add-on “TIBCO Spotfire Application Data Services”:
http://spotfire.tibco.com/products/application-data-services.aspx
Tableau is working on similar “Adapter” and you can see the demo of it here:
http://www.tableausoftware.com/about/blog/2011/12/got-sap-bw-get-tableau-15088
I think SAP itself prefers Spotfire due its maturity and most readiness for Enterprise market; I tend to agree with SAP (only on this subject) for a different reason: Spotfire has rich API, scripting, integration with Visual Studio and more customizable.
Andrei
July 4, 2012 at 3:01 pm
Wow this stuff is better than any forrester and gartner magic quardrant. Whoever makes up the categories for magic quardrants has never worked a day with a BI platform. I know it’s hard to compare every BI platform, but have you evaluated Pentaho and where does it stack up against some of the ones that you has listed above? Thanks for the excellent write up.
July 9, 2012 at 2:46 pm
Good work. I wanted to give the basic Tableau updates to your list when you have chance.
Tableau now has direct connection to SAP B/W.
The release of Tableau 7.0 and the launch of High Availability now means Tableau is Enterprise ready.
Visual Drill down for Tableau with the in memory engine and Tableau Server changes means that Tableau has replaced QV offering with a powerful alternative.
Another comparator has to be TCO which Microsoft is struggling with against the new products.
The BYOD movement and the support of mobile platforms, Tableau now has iPad and Andriod support, dont know about the others.
Additionally Tableau has almost no scripting so is a true end user tool.
You should also mention the QV limitation of only working with extracts in our Big Data /Cloud world we need direct connectors which rules QV out
November 6, 2012 at 1:02 pm
Hello Andrei,
Many thanks for this wonderful analysis.
Spotfire, Tableau and Qlickview are the largest players in the area of data visualization. I was wondering if Gooddata, RJMetrics and Chartio fall within the same category. Are they comparable but just on a smaller scale? Or would you consider their solutions rather tailored for small and medium sized businesses?
Thank you for clarifying.
November 28, 2012 at 2:59 pm
Formally very many tools can be considered as data visualization tools.
As i said many times on this blog, I can recommend only 3 leaders: Tableau, Qlikview and Spotfire and others cannot be compared with leaders and I see that GAP is widening every year. I also maintain my position that Microsoft still have an opportunity to catch-up, but this opportunity is shrinking with every new mistake Microsoft is making…
December 11, 2012 at 5:57 am
Hello Andrei,
thanks for your comparison. Here is another one: http://bib.dbvis.de/uploadedFiles/zhang.pdf
Behrisch, Keim, Last, Mittelstädt, Pompl, Schreck, Stoffel, Weber, Zhang.
“Visual analytics for the big data era – a comparative review of state-of-the-art commercial systems.”
in Proceedings of IEEE Symposium on Visual Analytics Science and Technology, 2012.
March 5, 2013 at 10:17 am
Dear Andrei, I really like your chart. I wonder how you would rate http://www.yellowfinbi.com.
Regards, Niels
March 5, 2013 at 10:52 am
Dear Niels:
I do like YellowFin, but in order for me to compare it and recommend it, I need a few things like real time to do it and complete access to all software involved and I do not have it. If I will have time, I probably will spend my own time trying to compare and evaluate D3 Javascript Library before anything else – but you never know. I really like D3 Demos here:
https://github.com/mbostock/d3/wiki/Gallery and D3 API.
Andrei
March 11, 2013 at 6:22 am
Hello Andrei,
I am working on a project where we have SAS widely used for Analytics.
The business are using Tableau (and SAS). They feel the visualization is far superior and non-developers are comfortable using it. Do you have any comparisons or links on Tableau v SAS 9.3? My thoughts are to retain both and give a functional guidance list for use in the project e.g. at the high level SAS is analytical, Tableau is more Presentational.
Regards Derek
PS: Your blog is good, it covers the important specifics.
March 11, 2013 at 8:35 am
Hi Derek:
SAS is the excellent product for Analytics, especially when paired with Visualization Tool like Tableau or Spotfire. There is no reason to compare Tableau and SAS 3.3: it is like comparing Apples and Oranges.
If you can afford SAS, then keep it, if not, I suggest to use R. Tableau does not have that SAS or R functionality, but Spotfire does – it has own commercial and integrated implementation of R, called S-Plus.
I agree with you: keep both Tableau for Visualization and SAS for Analytics and try to integrate those two excellent products in your projects.
Andrei.
P.S. SAS can be compared with R, but it is outside of the scope of my blog.
May 20, 2013 at 8:21 am
[…] https://apandre.wordpress.com/tools/comparison/ […]
May 29, 2013 at 12:44 pm
Hello Andrei,
We are currently using Spotfire but we are looking for alternative (mainly for financial reasons) even if we are really satisfied with Spotfire. We use it mainly for basic data visualizations and also with some analytics using R.
Would you recommend any other software comparable to Spotfire that will suit our needs ? We had a shot with SAP Visual Intelligence but it seems to be far away behind Spotfire.
Any suggestion or advice will be much appreciated.
Regards,
July 29, 2013 at 12:23 pm
Hi John:
if you already have Spotfire, and learned how to use it, my advise is to keep it, especially if you need integration with R. Spotfire 5.5 is the most mature product, you may try Tableau 8 (it is easier, but still 32-bit and no R) or Qlikview 11.2 (their use of RAM is better, but no R and their Direct Discovery is not mature yet) but it will be more to learn for you and pricing almost the same.
July 16, 2013 at 3:57 am
Hello Andrei,
Thank you for the great analysis!
I am in the process of selecting a BI tool to meet our client needs and would like to get your expert suggestion given the following expectations of the BI Visual Analytics/Reporting tool:
1. Supports traditional tabular reporting; Plain table display, crosstab and three dimensional tabular reporting.
2. Rich visual analytics.
3. Amazon Redshift database integration (Data will be hosted in here).
4. Adhoc reporting capabilities. Self-service BI – should enable business users to create/modify reports on their own.
5. DB write back feature enabling users to write data back to DB.
6. Web interface for Viewing and Authoring.
7. Dashboards and drill-down options.
8. Mobile Access.
9. Cloud hosting (SaaS/PaaS).
I have some hands-on experience with Tableau and while meets most of the above criteria, it lacks in the following areas:
1. No DB Write-back option (There is an way in Tableau to perform this, but it is more of a hack, not a documented feature of the tool).
2. While Tableau is an excellent visualization tool with rich chart types/features, traditional tabular reporting is not it’s strength.
3. No cloud offerings from the vendor.
Qlikview: Based on what I read in the public forums, it is more developer dependant. Lacks in self service front.
MicroStrategy seem to satisfy most of these needs. But your rating for this product is no good.
July 16, 2013 at 10:50 am
Hi Sukumar:
Tableau is not a reporting tool, if you need reporting then may be Microstrategy is a way to go for you.
However I disagree with you that Tableau has no “cloud offering”. It has actually 2 of them: one is Tableau Public (free) and other is Tableau Public Premium (former Tableau Digital), see it here: http://www.tableausoftware.com/products/public#tableau-public-premium
and here: http://www.tableausoftware.com/public/blog/2012/10/tableau-public-premium-1683
Also Microstrategy is not a best choice if you need “self-service” BI.
Your argument against Qlikview is not valid, because Microstrategy needs much more attention from developers compare with Qlikview.
And don’t forget Spotfire and Spotfire Silver either.
Overall, I cannot recommend Microstrategy, unless the need for traditional “tabular” reporting is your major requirement…
July 17, 2013 at 6:03 am
Andrei, Thank you for your quick response and valuable insight! Yes, we have quite a bit of tabular reporting needs along with requirements for rich visual analytics.
Unfortunately we cannot use the Tableau Public Premium as we should restrict the access to both data as well as the views. Also we are looking at large enterprise data set, size in TBs and can grow further. And it does not support live data connection per this post: http://community.tableausoftware.com/thread/122124?start=0&tstart=0.
Yes, we do need self-service features. I will explore Qlikview and Spotfire. Thanks again!
July 17, 2013 at 8:27 am
@Sukumar: live data connection is not a big limitation, since Tableau 8 introduced Data Extract API, so you can automatically refresh Data Snapshot as often as you need on your workstation and then republish workbooks with refreshed data into Tableau Public Premium Server…
As far as Spotfire goes, it is the most mature product on market, especially newly released version 5.5. For your purposes I recommend to explore Spotfire Silver here: https://silverspotfire.tibco.com/us/silver-spotfire-version-comparison and
https://silverspotfire.tibco.com/us/get-spotfire/silver-spotfire-feature-matrix ,
especially Spotfire Silver Analyst and Spotfire Silver Publisher.
August 31, 2013 at 6:21 pm
Thank you for the great analysis!
I am in the process of selecting a Big Data tool to meet our client needs and would like to get your expert suggestion about Endeca vs the other tools
Thank
Iris
September 1, 2013 at 9:24 am
Hi Iris: if you will spend more time on my blog, you will notice my natural skepticism toward term “Big Data”. In short I think it is a BS. Endeca is not in scope of my blog, so I cannot compare it with 3 DV Leaders I mostly talking about. Between those 3 here are my thoughts:
1. Tableau: No matter how many time representatives of Tableau Software will say that they are ready for Big Data (sometime they are saying more then that), I disagree with them because even Tableau 8 and most Tableau 8 server processes are 32-bit and they simply cannot handle Big Data in reasonable time.
2. Qlikview: Until Release 11.2 Qlikview can handle only data in memory/RAM and therefore it was not ready for Big Data. In version 11.2 Qlikview added Direct Discovery, which is intended to enable Qlikview to use data from disks. However current implementation of Direct Discovery is a disaster performance-wise, so I cannot say yet that Qlikview is ready for Big Data. But I expect Qlikview 12 will be better in this regard, at least I hope Qliktech can learn from own mistakes.
3. Spotfire: TIBCO’s Spotfire 5.5 is the most mature and most prepared for Big Data among all leading Data Visualization platforms. I personally not too happy about it’s performance with large datasets, but it can be improved with usage of better hardware. So with a lot of resistance (because BigData is a BS) I can recommend Spotfire 5.5 as of now, 9/1/13, but it may change in the future.
4. If you will go outside of pure DV tools, Microsoft BI stack seems to me the most advanced toward “BigData readiness”.
September 7, 2013 at 7:13 pm
Andrei, perhaps the concepts of ‘in memory’ BI & big data are, on some level, opposed. Traditional BI players (Business Objects, Cognos, and especially MicroStrategy) are well positioned for big data because they hit directly against the underlying relational data sources. For in-memory tools, this technique came as an afterthought, sort of like in-memory came as an afterthought to the traditional players.
Ben
September 7, 2013 at 7:39 pm
Hi Ben:
I partially agree, but in your comment you used 2 buzzwords and only one real concept: buzzword “BI” (which is an obsolete marketing umbrella and obsolete traditional buzzword, abused by “Traditional BI Players” (as you call them), “in-memory” Data Engines (absolutely necessary concept for interactive Data Visualization) and Big Data (which is basically an empty buzzword and not a concept). In that sense they are opposed as much as buzzwords opposed to “real” concept.
November 30, 2014 at 10:52 am
Hi Andrei,
is it possible to update this comparison based on current trend and recent development in QlikView and Tableau and Qlik sense?
November 30, 2014 at 11:29 am
Qlikview was not updated for many years (still 11.2), Qlik Sense does not make sense to me and cannot be compared (unless you wish to compare apples and oranges), Spotfire’s future destroyed by TIBCO. As of today (11/30/14), Tableau is a clear leader and comparing it to other visualization products will be a waste of time.