Excel as a Business Intelligence Platform – Part 3
Author: Ugur Kadakal, Ph.D., CEO and founder of Pagos, Inc.
Publishing of Excel Dashboards on the Internet
Introduction
In previous article (see “Excel as BI Platform” here) I discussed Excel’s use as a Business Intelligence platform and why it is exceedingly popular software among business users. In 2nd article (“Dos&Don’ts of Building Successful Dashboards in Excel”) I talked about some of the principles to follow when building a dashboard or a report in Excel. Together this is a discussion of why Excel is the most powerful self-service BI platform.
However, one of the most important facets of any BI platform is web enablement and collaboration. It is important for business users to be able to create their own dashboards but it is equally important for them to be able to distribute those dashboards securely over the web. In this article, I will discuss two technologies that enable business users to publish and distribute their Excel based dashboards over the web.
Selection Criteria
The following criteria were selected in order to compare the products:
- Ability to convert a workbook with most Excel-supported features into a web based application with little to no programming.
- Dashboard management, security and access control capabilities that can be handled by business users.
- On-premise, server-based deployment options.
Criteria #3 eliminates online spreadsheet products such as Google Docs or Zoho. As much as I support cloud based technologies, in order for a BI product to be successful it should have on-premise deployment options. Without on-premise you neglect the possibility of integration with other data sources within an organization.
There are other web based Excel conversion products on the market but none of them meet the criteria of supporting most Excel features relevant to BI; therefore, they were not included in this article.
The two products I selected that meet the criterias above are:
- Microsoft SharePoint 2010
- Pagos SpreadsheetWEB v3.2
There are two distinct sections made available by SharePoint that I will cover in the article: SharePoint reporting using Excel Services and Office Web Apps. Office Web Apps were also made available by Microsoft through SkyDrive free of charge. Here I will discuss the features available through SharePoint only. To maintain objectivity, I must give full disclosure and inform you that SpreadsheetWEB is developed by my company Pagos.
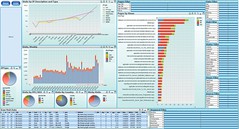
To test the first criteria, I selected a relatively simple Excel dashboard named the “Global Electricity Consumption Dashboard”, which can be downloaded from SpreadsheetZONE at http://www.spreadsheetzone.com/templateview.aspx?i=102. The dashboard contains raw data, calculated fields, dependent combo boxes and several different types of charts.
SharePoint
Conversion of the workbook to a SharePoint report is a tedious and time consuming process. Once the workbook is uploaded to the SharePoint server, you need to identify each chart separately through the interface. Unfortunately this was the easiest part of the whole conversion. Putting those charts together in one page and placing combo boxes and calculated/formatted fields required .NET programming.
In the end you can create the same look, feel and functionality as your Excel based dashboard. But it took a few hours of work and .NET programming expertise that no business user is expected to possess.
The second attempt on Sharepoint was made by publishing the workbook through Office Web Applications. Publishing the workbook through Office Web Applications is relatively easy. However, the final interface is a grid-like spreadsheet interface where user can access everything in the Excel file. It is not possible to limit the end user’s access to the data and calculations portions of the workbook in order to only provide access to the dashboard portion including inputs controls combo boxes, etc. There is no security within the file itself, such as hiding tabs or disabling cells. People who can edit any cells in the worksheet can also make permanent saves. People without editing privileges cannot change any cell data, so the worksheet itself is unusable as a spreadsheet or dashboard unless full permissions are allocated to an individual. This makes it very difficult to publish a dashboard to a user group with execute rights only and another audience with edit rights.
Another important limitation of SharePoint is that some of the key features used in Excel based dashboards are not supported. The most important of these are user interface features such as form controls. While PivotTable controls such as filters and slicers are supported, without some of the other controls it is very difficult to build powerful user interactivity. There is always the option of coding in SharePoint but it defeats the purpose of a self-service BI tool. Other helpful features that are not supported in SharePoint include comments and data validation.
One major problem I have with SharePoint is that those workbooks containing unsupported features will not load. Even if you have a single validation somewhere in your workbook, you will not be able to publish it through SharePoint. You will have to modify the file and remove all unsupported features before you can use it with SharePoint.
SharePoint has an attractive user interface that replicates the same aesthetic that is present in many of Microsoft’s other products. You have a list of documents uploaded and their respective folders. The folder system is well managed, allowing you to set privileges based on which folder certain files are located in, as well as an easy-to-use, drag-and-drop upload feature so you can just drag your files into the browser window to upload them.
SpreadsheetWEB
Using the SpreadsheetWEB Excel add-in, publishing the workbook through the wizard took a few minutes. It requires no programming expertise. Once published on the SpreadsheetWEB server, the dashboard retained all of the functionalities of the original Excel dashboard.
SSW supports many of the features that SharePoint does not, including data validation, data retrieval services, comments, PivotTables and form controls. All of these are set up through the Wizard and become active in the finalized web application. Some of the features, including form controls and comments, require no specific setup for conversion. Others, such as data retrieval services, can be set up through either the wizard or a separate option in the SSW Excel ribbon. SSW also supports data collection, allowing you to create a database from the submitted data records.
SpreadsheetWEB’s Control Panel interface is quite different than the one offered by SharePoint. It is not oriented around sharing between friends or contacts; rather, it takes a slightly different approach that is focused on productivity and application development/management. There is a similar applications list, along with immediate options to open, edit, delete and download the web applications. All of the necessary information is located within this list, including a direct link to the data collected (if the web application stores data records), security preferences, online status, groups and notes. This makes it so that you are never farther than a few clicks away from the action you’d like to take. The interface is also divided into seven tabs: Applications, Processes, Data, Users & Groups, Specials, Analytics and My Account. This organization makes it easy to sift between the necessary options and actions if they are not immediately present in the Applications tab.
SpreadsheetWEB offers a multitude of security features, adding a huge number of accessible layers to fit your security preferences. Firstly, files are stored on a dedicated server, either hosted by Pagos or hosted by the company purchasing the software. They offer a file system just like SharePoint except SSW’s file system is organized in a more comprehensive and user-friendly way. There are user and group settings, so you can create accounts for users and form groups of users as well as applications. You can set permissions for individual applications or users as well as groups of applications and groups of users. Users sign in on the SSW Control Panel and are only able to access the tabs that are necessary for them to view, as well as the applications that are allocated to them. User roles are customizable, allowing you to set defaults for certain groups of individuals without having to set them one by one. You can also require a log-in page for your application and offer your clientele a user name and password for that particular application without them ever having to use the control panel.
There is another layer of security features within the applications themselves. You can disable/enable cells and hide tabs based on the end-user’s permissions. This means that the people that need to see certain portions of the application will be able to, while those who don’t have the necessary clearance will not even know that they exist. You can also set certain data sets/records for analysis by a single user or group, so that certain users will have access to certain data sets that require their attention without having access to others.
Summary
Microsoft Excel is the most popular BI platform. Its flexibility and self-service capabilities create this popularity among business users. However, in the internet age, collaboration and the ability to publish securely over the web is an important requirement for any BI software and Excel lacks this ability. In this article I discussed two products, SharePoint and SpreadsheetWEB, which can turn traditional Excel based dashboards into web based dashboards.
While both products have certain strengths and weaknesses, I will leave the final evaluation to the reader as I might be considered biased towards SpreadsheetWEB. I strongly encourage the reader to perform their own evaluation as both products offer free trials.



Leave a comment