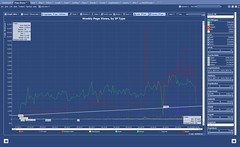
Visual Drill-down and Data Exploration can give users most of visible properties of given dataset, but they can miss some hidden attributes and patterns. To discover those hidden “treasures” data have to be processed with variety of calculations, approaches and multiple methods, which usually defined as Visual Analytics (alternative names can be Data Analytics or Business Analytics etc.). Among those methods are formulas and expressions to define calculated measures, regression, correlation and factor analysis, analysis of variance (ANOVA), other statistical models, optimization models. DV Tools enable DV developers and users to script their analytical models (e.g through VBScript or IronPython) and integrate with analytical libraries, like R-Library. Good DV tool usually allows to visualize analytical results as natural extension of other visualization approaches.
Curt Monash recently published a good list of useful things you can do with analytics.
Permalink: https://apandre.wordpress.com/dv/analytics/



Leave a comment