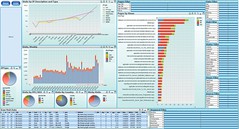
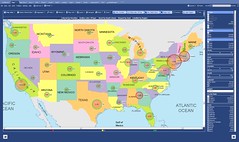
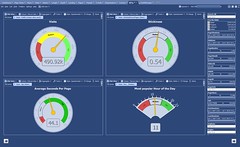
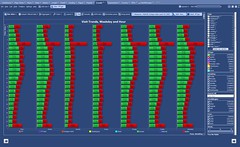
When size of dataset exceeds the capacity of human eye, when number of rows, columns, tables, documents and business logic is too much for a manual Data Exploration, it is appropriate to switch to DataViews. DataViews can be loosely defined as Charts, which graphically are presenting of underlying SQL Views with exception that underlying dataset can be very different from relational Database. DataViews allow user to have multiple (optionally synchronized) views of linked Graphical Projections (with reduced dimensionality) of the main Data Set. Across of this website we prefer to use the term of the DataCloud as a synonym of the main Dataset under Visulization. DataCloud usually a set of overlapping and interconnected multidimensional Data Cubes, Databases, other Data Sets, Data Stores etc.
Graphical Projection usually defined as a 2-dimensional projection of a 3-dimensional object like you can see below at the bottom of this page: 3 of 2-dimensional “First Angle Projections” of one 3-dimensional object.
DataView is a modification of the concept of a Graphical Projection: it is a protocol by which an image of an N-dimensional object is projected onto a M-dimensional surface, where M < N, M usually 2 and N usually 3 or larger than 3. Those modification an be described in at least 4 ways:
- original object usually is not a 3-dimensional, but rather N-dimensional where N can be much larger than 3;
- original object itself is a multidimensional dataset (like OLAP Cube or datatable) rather than geometrical object;
- result of projection is an interactive Chart (like Bar, Pie, Line, Sparkline, Motion Chart, Mekko, Area, Scatter, Heatmap, Radar, Map, Bubble, Funnel etc.), see most usual samples of Charts on this site referenced as a Chartology list.
- Chart as a DataView can present more that 2 data Dimensions. For example, so called Motion Chart (a la Hans Rosling) can represent up to 6 Data Dimensions: axis X as Income, axis Y as Fertility, Size of Shape as a Population, Color as a Country, Playback Dial as Year and the Form of the Shape can even be used for 6th Data Dimension… while all human eye is see is 2-dimensional images.



Leave a comment