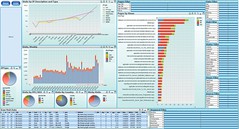
Microstrategy


Something dramatic happened during October 2013 with Data Visualization (DV) Market and I feel it everywhere. Share Prices for QLIK went down 40% from $35 to $25, for DATA went down 20% from $72 to below $60, for MSTR went up 27% from $100 to $127 and for DWCH went up  25% from $27.7 to $34.5. This blog got 30% more visitors then usual and it reached 26000 visitors per month of October 2013!

dwchPlus3DVPricesOctober2013So in this blog post I revisited who are actually the DV leaders and active players in Data Visualization field, what events and factors important here and I also will form the DVIndex containing 4-6 DV Leaders and will use it for future estimate of Marketshare and Mindshare in DV market.

In terms of candidates for DV Index I need measurable players, so I will prefer public companies, but will mention private corporations if they are relevant. I did some modeling and it turned out that the best indicator for DV Leader if its YoY (Year-over-Year Revenue growth) is larger than 10% – it will separate obsolete and traditional BI vendors and me-too attempts from real DV Leaders.

Let’s start with traditional BI behemoths: SAP, IBM, Oracle and SAS: according to IDC, their BI revenue total $5810M, but none of those vendors had YoY (2012-over-2011) more then 6.7% ! These 4 BI Vendors literally desperate to get in to Data Visualization market (for example SAP Lumira, IBM is getting desperate too with Project Neo (will be in beta in early 2014), Rapidly Adaptive Visualization Engine (RAVE), SmartCloud Analytics-Predictive Insights, BLU Acceleration, InfoSphere Data Explorer or SAS Visual Analytics) but so far they were not competitive with 3 known DV Leaders (those 3 are part of DVIndex for sure) Qlikview, Tableau and Spotfire

5th traditional BI Vendor – Microsoft had BI revenue in 2012 as $1044M, YoY 16% and added lately a lot of relevant features to its Data Visualization toolbox: Power Pivot 2013, Power View, Power Query, Power Map, SSAS 2012 (and soon SQL Server 2014) etc. Unfortunately Microsoft does not have Data Visualization Product but pushing everything toward Office 365, SharePoint and Excel 2013, which cannot compete in DV market…

6th Traditional BI vendor – Microstrategy made during October 2013 a desperate attempt to get into DV market by releasing 2 free Data Visualization products: Microstrategy Desktop and Microstrategy Express, which are forcing me to qualify Microstrategy for a status of DV Candidate, which I will include (at least temporary) into DVIndex.  Microstrategy BI revenue for TTM (Trailing 12 months) was $574, YoY is below 5% so while I can include it into DVIndex, I cannot say (yet?) that Microstrategy is DV Leader.

Datawatch Corporation is public (DWCH), recently bought advanced Data Visualization vendor – Panopticon for $31M. Panopticon TTM Revenue approximately $7M and YoY was phenomenal 112%  in 2012! Combining it with $27.5M TTM Revenue of Datawatch (45% YoY!) giving us approximately 55% YoY for combined company and qualifying DWCH as a new member of DVIndex!

Other potential candidates for DVIndex can be Panorama (and their Necto 3.0 Product), Visokio (they have very competitive DV Product, called Omniscope 2.8), Advizor Solution with their mature Advizor Visual Discovery 6.0 Platform), but unfortunately all 3 companies choose to be private and I have now way to measure their performance and so they will stay as DV Candidates only.

In order to monitor the progress of open source BI vendors toward DV Market, I also decided to include into DVIndex one potential DV Candidate (not a leader for sure) – Actuate with their BIRT product. Actuate TTM revenue about $138M and YoY about 3%. Here is the tabular MarketShare result with 6 members of DVIndex:

MarketShareIndex

Please keep in mind that I have no way to get exact numbers for Spotfire, but I feel comfortable to estimate Spotfire approximately as 20% of TIBCO numbers. Indirect confirmation of my estimate came from … TIBCO’s CEO and I quote: “In fact, Tibco’s Spotfire visualization product alone boasts higher sales than all of Tableau.” As a result I estimate Spotfire’s YoY is 16% which is higher then 11% TIBCO has. Numbers in table above are fluid and reflect the market situation by the end of October 2013. Also see my attempt to visualize the Market Share of 6 companies above in simple Bubble Chart (click on it to Enlarge; where * X-axis: Vendor’s Revenue for last TTM: 12 trailing Months, * Y-axis: Number of Full-Time Employees, working for given Vendor, * Sized by Market Capitalization, in $B (Billions of Dollars), and * Colored by Year-Over-Year revenue Growth):

MarketShare

For that date I also have an estimate of Mindshare of all 6 members of DVIndex by using the mentioning of those 6 companies by LinkedIn members, LinkedIn groups, posted on LinkedIn job openings and companies with Linkedin profile:

MindShareIndex

Again, please see below my attempt to represent Mindshare of those 6 companies above with simple Bubble Chart ((click on it to Enlarge; here 6 DV vendors, positioned relatively to their MINDSHARE on LinkedIn and where * X-axis: Number of LinkedIn members, mentioned Vendor in LinkedIn profile, * Y-axis: Number of LinkedIn Job Postings, with request of Vendor-related skills, * Sized by number of companies mentioned them on LinkedIn and * Colored by Year-Over-Year revenue Growth):

MindShare

Among other potential DV candidates I can mention some recent me-too attempts like Yellowfin, NeitrinoBI, Domo, BIME, RoamBI, Zoomdata and multiple similar companies (mostly private startups) and hardly commercial but very interesting toolkits like D3. None of them have impact on DV Market yet.

Now, let’s review some of October events (may add more October events later):

1. For the fourth quarter, Qliktech predicts earnings of 28 cents to 31 cents a share on revenue between $156 million and $161 million. The forecast came in significantly lower than analysts’ expectations of 45 cents a share on $165.78 million in revenue. For the full year, the company projects revenue between $465 million and $470 million, and earnings between 23 and 26 cents a share. Analysts had expectations of 38 cents a share on $478.45 million. As far as I concern it is not a big deal, but traders/speculants on Wall Street drove QLIK prices down almost 40%

2. Tableau Software Files Registration Statement for Proposed Secondary Offering. Also Tableau’s Revenue in the three months ended in September rose to $61 million, 10 millions more then expected – Revenue jumped 90%! Tableau CEO Christian Chabot said the results were boosted by one customer that increased its contract with the company. “Our third quarter results were bolstered by a large multimillion-dollar deal with a leading technology company,” he said. “Use of our products in this account started within one business unit and over the last two years have expanded to over 15 groups across the company. “Recently, this customer set our to establish an enterprise standard for self-service business intelligence, which led to the multimillion-dollar transaction. This deal demonstrates the power and value of Tableau to the enterprise.” However DATA prices went down anyway in anticipation of a significant portion of these Shares Premium prices should quickly evaporate as the STOCK Options lock-up will expire in November 2013.

3. TIBCO TUCON 2013 conference somehow did not help TIBCO stock but in my mind brought attention to Datawatch and to the meteoric rise of DWCH stock (on Chart below compare it with QLIK and TIBX prices, which basically did not change during period of March-October of 2013) which is more then tripled in a matter of just 8 months (Datawatch bought and integrated Panopticon during exactly that period):

DWCHvsQLIKvsTIBXMar_Oct20134. Datawatch now has potentially better software stack then 3 DV Leaders, because of Datawatch Desktop is integrated with Panopticon Desktop Designer and Datawatch Server is integrated with Panopticon Data Visualization Server; it means that in addition to “traditional” BI + ETL + Big Data 3V features (Volume, Velocity, Variety) Datawatch has 4th V feature, which is relevant to DV Market: the advanced Data Visualization. Most visualization tools are unable to cope with the “Three V’s of Big Data” – volume, velocity and variety. However, Datawatch’s technology handles:

  • Data sources of any size (it has to be tested and compared with Qlikview, Spotfire and Tableau)

  • Data that is changing in real time (Spotfire has similar, but Qlikview and Tableau do not have it yet)

  • Data stored in multiple types of systems and formats

We have to wait and see how it will play out but competition from Datawatch will make Data Visualization market more interesting in 2014… I feel now I need to review Datawatch products in my next blog post…

Famous Traditional BI vendor got sick and tired to be out of Data Visualization market and decided to insert itself into it by force by releasing today 2 Free (for all users) Data Visualization Products:

  • MicroStrategy Analytics Desktop™ (Free self-service visual analytics tool)

  • MicroStrategy Analytics Express™ (Free Cloud-based self-service visual analytics)

That looks to me as the huge Disruption of Data Visualization Market: For example similar Desktop Product from Tableau costs $1999 and Cloud Product called Tableau Online costs $500/year/user. It puts Tableau, Qlikview and Spotfire to a very tough position price-wise. However only Tableau stock went down almost $3 (more then %4) today, but MSTR, TIBX an QLIK basically did not react on Microstrategy announcement):

DataMstrQlikTibx

And don’t think that only MIcrostrategy trying to get into DV market. For example SAP did similar (in less-dramatic and non-disruptive fashion) a few months ago with SAP Lumira (Personal Edition is free), also SAP Cloud and Standard edition available too, see it here http://www.saplumira.com/index.php and here http://store.businessobjects.com/store/bobjamer/en_US/Content/pbPage.sap-lumira . SAP senior vice president and platform head Steve Lucas 10 weeks ago was asked if SAP would consider buying Tableau, Lucas went in the opposite direction. “We aren’t going to buy Tableau,” Lucas said with a smile on his face. There’s no need to buy an overvalued software company.” Rather, SAP wants to crush companies like Tableau (I doubt it is possible, but SAP is free to try) and build own Data Visualization product line out of Lumira, read more at

http://venturebeat.com/2013/07/30/sap-platform-head-tableau-overvalued/#yFzUpzOh6ivMYvqP.99

If I will be Tableau, Qlikview or Spotfire I will not worry yet about Microstrategy competition yet, because it is unclear how the future R&D for free Analytics Desktop and Express will be funded – out of MicroStrategy Analytics Enterprise™ R&D budget? That can be tricky, considering as of right now Tableau hiring hard (163 open job positions as of yesterday!) and Qliktech is very active too (about 93 openings as of yesterday) and even TIBCO has 36 open positions just for Spotfire alone.

But I may start to worry about other DV Vendor – Datawatch, who recently completed the acquisition of Panopticon. Datawatch grew 45% YoY (2012-over-2011), has only 124 employees but $27.5M in sales, very experienced leadership, 40000+ customers worldwide and mature product line. May be another evidence of it here:

http://online.wsj.com/article/PR-CO-20131023-907942.html

The three MicroStrategy Analytics Platform products also share a common user experience—making it easy to start small with self-service analytics and grow into the production-grade features of Enterprise. Desktop and Express from Microstrategy can be naturally extended (for fee)  to a new enterprise-grade BI&DV Suite, also released today and called MicroStrategy Analytics Enterprise™ (known under other name as MIcrostrategy Suite 9.4). 

New MicroStrategy Analytics Enterprise 9.4 includes data blending, which allows users to combine data from more than one source; the software stores the data in working memory without the need for a separate data integration product.  9.4 can connect with the MongoDB NoSQL data store as well as Hadoop distributions from Hortonworks, Intel and Pivotal. It comes with the R, adds better ESRI integration. The application can now fit 10 times as much data in memory as the previous version could, and the self-service querying now runs up to 40 percent faster.

MicroStrategy Analytics Enterprise™ Suite is also available starting today for free for developers and non-production use: 10 named user licenses of MicroStrategy Intelligence Server, MicroStrategy Web Reporter and Analyst, MicroStrategy Mobile, MicroStrategy Report Services, MicroStrategy Transaction Services, MicroStrategy OLAP Services, MicroStrategy Distribution Services, and MultiSource Option. 1 named user license of development software, MicroStrategy Web Professional, MicroStrategy Developer, and MicroStrategy Architect The server components have a 1 CPU limit).

Quote from Wayne Eckerson, President of  BI Leader Consulting: “The new MicroStrategy Analytics Desktop makes MicroStrategy a top-tier competitor in the red-hot visual discovery market. The company was one of the first traditional enterprise BI vendors to ship a visual discovery tool, so its offering is mature compared to others in its peer group, but it was locked away inside its existing platform. By offering a stand-alone desktop visual discovery tool and making it freely available, MicroStrategy places itself among” Data Visualization Leaders.

You also can read today’s article from very frequent visitor to my blog (his name Akram), who is the Portfolio and Hedge Manager, Daily Trader and excellent investigator of all Data Visualization Stocks, DV Market and DV Vendors. His article “Tableau: The DV Market Just Got More Crowded”  can be found here (cannot resist to quote: “Microstrategy is priced like it has nothing to do with this space, and Tableau is priced like it will own the whole thing.”):

http://seekingalpha.com/article/1760432-tableau-the-dv-market-just-got-more-crowded?source=yahoo

Heatmap generated by Microstrategy Analytic Desktop

Heatmap generated by Microstrategy Analytic Desktop

MicroStrategy Analytics Desktop.

It’s free visual analytics: Free Visual Insight, 100M per file, 1GB total storage, 1 of user, Free e-mail support for 30 days. Free access to online training, forum, and knowledge base.
Data Sources: xls, csv, RDBMSes, Multidimensional Cubes, MapReduce, Columnar DBs, Access with Web Browser, export to Excel, PDF, flash and images, email distribution. The product is freely available to all and can be downloaded instantly at:http://www.microstrategy.com/free/desktop .

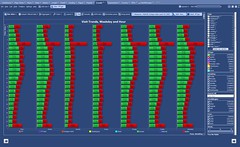
TRellis of Bar Charts generated by Microstrategy Analytics Desktop

TRellis of Bar Charts generated by Microstrategy Analytics Desktop

Kevin Spurway, MicroStrategy’s vice president of industry and mobile marketing said: “The new desktop software was designed to compete with other increasingly popular self-serve, data-discovery desktop visualization tools offered by Tableau and others”. To work with larger data sets, a user should have 2GB or more of working memory on the computer, Spurway said. See more here:

http://www.microstrategy.com/Strategy/media/downloads/free/analytics-desktop_quick-start-guide.pdf

MicroStrategy Analytics Express.

MicroStrategy Analytics Express is a software-as-a-service (SaaS)-based application that delivers all the rapid-fire self-service analytical capabilities of Desktop, plus reports and dashboards, native mobile applications, and secure team-based collaboration – all instantly accessible in the Cloud. Today, the Express community includes over 32,000 users across the globe.

In this release, Express inherits all the major functional upgrades of the MicroStrategy Analytics Platform, including new data blending features, improved performance, new map analytics, and much more. For a limited time, MicroStrategy is also making Express available to all users free for a year. With this valuable offer, users will be able to establish an account, invite tens, hundreds, or even thousands of colleagues to connect, analyze and share their data and insight, and do it all at no charge. For some organizations, the potential value of this offer can be $1 million or more. Users can sign up, access the service, and take advantage of this offer instantly at

www.microstrategy.com/free/express

MicroStrategy Analytics Express includes Free Visual Insight, Free web browser and iPad access, Free SaaS for one year, 1GB upload per file, unlimited number of users, Free e-mail support for 30 days. Free access to online training, forum, and knowledge base. Data Sources: xls, csv, RDBMSes Columnar DBs, Drobbox, Google Drive Connector, Visual Insight, a lot of security and a lot more, see http://www.microstrategy.com/Strategy/media/downloads/free/analytics-express_user-guide.pdf

All tools from Microstrategy Analytics Platform (Desktop, Express and Entereprise Suite) support standard list of Chart Styles and Types: Bar (Vertical/Horizontal Clustered/Stacked/100% Stacked), Line (Vertical/Horizontal Absolute/Stacked/100% Stacked), Combo Chart (of Bar and Area)Area (Vertical/Horizontal Absolute/Stacked/100% Stacked)

Area Chart Generated by Microstrategy Analytics Express

Area Chart Generated by Microstrategy Analytics Express

Dual Axis ( Bar/Line/Area Vertical/Horizontal), HeatMap, Scatter, Scatter Grid, Bubble, Bubble Grid, Grid,

Data Grid generated by Microstrategy Analytics Express

Data Grid generated by Microstrategy Analytics Express

Pie, Ring, ESRI Maps,

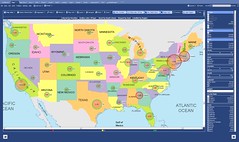
Microstrategy Analytics Desktop and Express integrate and generate ESRI Map Visualizations

Microstrategy Analytics Desktop and Express integrate and generate ESRI Map Visualizations

Network of Nodes, with lines representing links/connections/relationship,

Network Graph Generated by Microstrategy Analytics Express

Network Graph Generated by Microstrategy Analytics Express

Microcharts and Sparklines,

e4Microcharts

Data and Word Clouds,

DataCloud

and of course any kind of interactive Dashboards as combination of all of the above Charts, Graphs, and Marks:

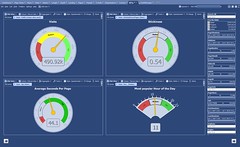
Interactive Dashboard Generated by Microstrategy Analytics Express

Interactive Dashboard Generated by Microstrategy Analytics Express

If you visited my blog before, you know that my classification of Data Visualization and BI vendors are different from researchers like Gartner. In addition to 3 DV Leaders – Qlikview, Tableau, Spotfire – I rarely have time to talk about other “me too” vendors.

However, sometimes products like Omniscope, Microstrategy’s Visual Insight, Microsoft BI Stack (Power View, PowerPivot, Excel 2013, SQL Server 2012, SSAS etc.), Advizor, SpreadshetWEB etc. deserve attention too. However, it takes so much time, so I am trying to find guest bloggers to cover topics like that. 7 months ago I invited volunteers to do some guest blogging about Advizor Visual Discovery Products:

Advizor Analyst vs. Tableau or Qlikview…

So far nobody in  USA or Europe committed to do so, but recently Mr. Srini Bezwada, Certified Tableau Consultant and Advizor-trained expert from Australia contacted me and submitted the article about it.  He also provided me with info about how Advizor can be compared with Tableau, so I will do it briefly, using his data and opinions. Mr. Bezwada can be reached at

sbezwada@smartanalytics.com.au , where he is a director at

http://www.smartanalytics.com.au/

Below is quick comparison of Advizor with Tableau. Opinions below belong to Mr. Srini Bezwada. Next blog post will be a continuation of this article about Advizor Solutions Products, see also Advizor’s website here:

http://www.advizorsolutions.com/products/

Criteria Tableau ADVIZOR Comment
Time to implement Very Fast Fast, ADVIZOR can be implemented within Days Tableau Leads
Scalability Very Good Very Good Tableau: virtual RAM
Desktop License $1,999 $ 1,999 $3,999 for AnalystX with Predictive modeling
Server License/user $1K, min 10 users, 299 K for Enterprise Deployment license for up to 10 named users $8 K ADVIZOR is a lot cheaper for Enterprise Deployment $75 K for 500 Users
Support fees / year

20%

20%

1st year included
SaaS Platform Core or Digital Offers Managed Hosting ADVIZOR Leads
Overall Cost Above Average Competitive ADVIZOR Costs Less
Enterprise Ready Good for SMB Cheaper cost model for SMB Tableau is expensive for Enterprise Deployment
Long-term viability Fastest growth Private company since 2003. Tableau is going IPO in 2013
Mindshare Tableau Public Growing Fast Tableau stands out
Big Data Support Good Good Tableau is 32-bit
Partner Network Good Limited Partnerships Tableau Leads
Data Interactivity Excellent Excellent
Visual Drilldown Very Good Very Good
Offline Viewer Free Reader None Tableau stands out
Analyst’s Desktop Tableau Professional Advizor has Predictive Modeling ADVIZOR is a Value for Money
Dashboard Support Excellent Very Good Tableau Leads
Web Client Very Good Good Tableau Leads
64-bit Desktop None Very Good Tableau still a 32-bit app
Mobile Clients Very Good Very Good
Visual Controls Very Good Very Good
Data Integration Excellent Very Good Tableau Leads
Development Tableau Pro ADVIZOR Analyst
64-bit in-RAM DB Good Excellent Advizor Leads
Mapping support Excellent Average Tableau stands out
Modeling, Analytics Below Average Advanced Predictive Modelling ADVIZOR stands out
Predictive Modeling None Advanced Predictive Modeling Capability with Built in KXEN algorithms ADVIZOR stands out
Flight Recorder None Flight recorder lets you track, replay, save your analysis steps for reuse by yourself or others. ADVIZOR stands out
Visualization 22 Chart types All common charts like  bar charts, scatter plots, line charts, Pie charts are supported Advizor has Advanced Visualizations like Parabox, Network Constellation
Third party integration Many Data Connectors, see Tableau’s drivers page ADVIZOR integrates well with CRM software: Salesforce.com, Ellucian, Blackbaud and others. ADVIZOR leads in CRM area
Training Free Online and paid Classroom Free Online and paid via company trainers & Partners Tableau Leads