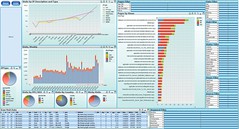
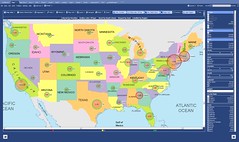
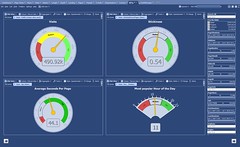
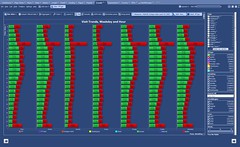
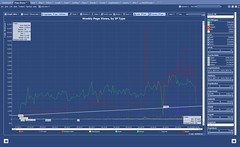
Eternal Ad-Hoc problem between BI Users and BI Developers: Users want to have flexible reports, but Developers in most cases can deliver only pre-defined (“rigid”) or ad-hoc reports. Visual Drill-down allows users to have a cake and eat it at the same time. Drill-down enables user to narrow data selection through either setting data filters to specific dictionary values or/and achieve similar result by visually choosing regions (e.g. rectangles) on interactive charts, so only values associated with regions will stay in data selection. In 2nd case charts behave as filters and as such eliminating need for filters if user prefer to use only selection tools like mouse.
Drilldown results also repainting all synchronized charts only with selected data. After drilling-down to appropriate dataset user can switch to Visual Data Exploration to examine trends, outliers, similarities and other data patterns.
This Page will be expanded with more details
Permalink: https://apandre.wordpress.com/dv/drilldown/



Leave a comment